
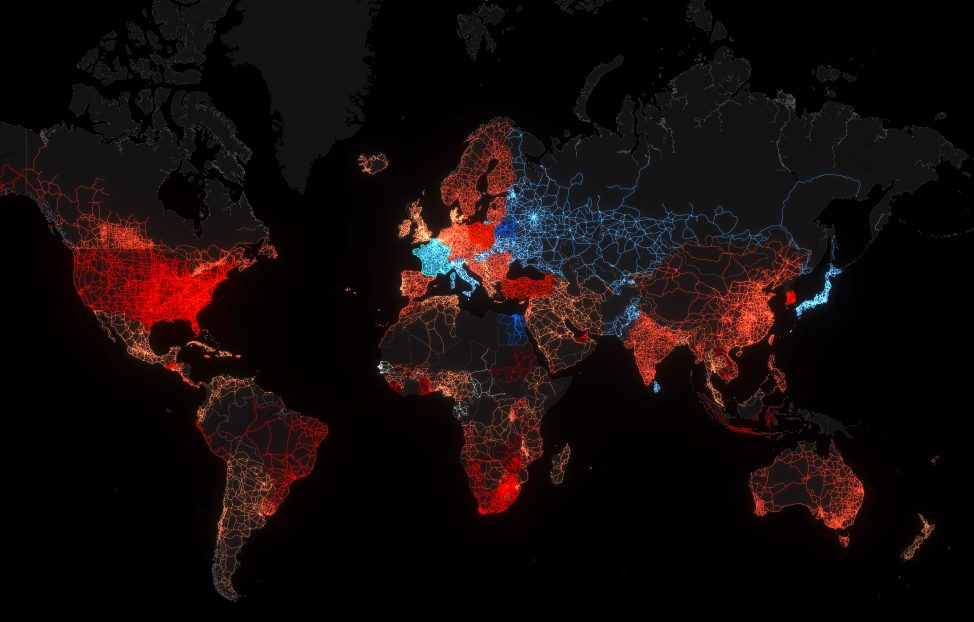
Mapping and analytics company Esri UK has created an interactive global petrol prices map, showing the increase and decrease in the average price of a litre of unleaded petrol, during the last six weeks.
 Esri UK
 Petrol prices soared to record highs in many countries around the globe in March, driven predominantly by increased demand following the easing of pandemic restrictions and supply disruptions caused by Russia’s invasion of Ukraine on 24 February.
Using the latest data from Global Petrol Prices, spanning 21 February to 4 April 2022, the map shows the significant differences around the world. In Europe, prices have increased the most in Monaco with a 30% rise to £1.89 per litre, followed by Poland by 24% to £1.21, while the largest decrease has been in Belarus with a 13% reduction to £0.52, followed by Ukraine by 4% to £0.87.
In comparison, average petrol prices have increased in the UK by 9% to £1.63 per litre in the same period.
Globally, the highest increase has been in Sudan with a 63% rise to £1.15, while the largest decrease remains Belarus with a 13% reduction to £0.52.
Esri UK created the visualisation by highlighting the road network in each country. Red shows an increase while blue portrays a price reduction and hovering over each country reveals the figures.
Check out the map here at: https://www.arcgis.com/apps/instant/media/index.html?appid=6f8d32ed95dc4d36906f0ae952330bc4